Tiet · Studio Builder
The Builder is the visual editor for Workflows in Tiet · Studio. You open it from Tiet · Studio → Workflows in the sidebar (route /studio/workflows). A workflow is a graph of nodes joined by edges; the engine runs the nodes in dependency order.
This page is a reference for the screen: every panel, button and menu item, with its exact label, and what it really does. To learn how data moves between nodes, read Ports, types and data flow. For the list of nodes, see the Node Catalog section in this sidebar. For running a workflow across sites see Run on mesh, and for environments see Environments & Promotion.
Workflows home
When no workflow is open, the builder shows the home page. It lists the workflows of the active project (see Projects in the Platform group of the sidebar) plus global templates. It has two tabs, each with a count:
| Tab | Contents |
|---|---|
| My Workflows | Your workflows as cards or as a list (the Grid / List switch remembers your choice). A search box (Search by name, description, or ID...). In the grid, sort buttons Name, Last run, Updated and Created (click again to reverse). A checkbox on each card or row selects it; a bulk bar then offers Duplicate, Move to project… and Delete for the selected workflows, and a summary says how many succeeded. |
| Templates & Examples | Ready-made workflows. Use template imports one and opens it in the editor. |
The New Workflow button (top right) opens a blank editor tab. If you have none, the page offers Create your first workflow.
Each card shows the name, a status icon for the last run, the version (v1.0), the node count, and Scheduled or Manual (Scheduled appears when the workflow's record carries a schedule_cron value). A card also shows one dot per environment of your organization (see Environments & Promotion). The dot of the project's own environment is always lit with the workflow version, because the draft lives there; another environment's dot is lit only when the workflow's status is deployed:<environment slug>, so the dots do not show per-environment deployments made through the API. A card also has Run now, Open in editor, and a menu with Duplicate and Delete (a confirmation asks Delete this workflow? This cannot be undone.).
A workflow whose stored definition cannot be parsed is still listed, marked in red, with Run now and Open in editor disabled. This is deliberate, so that saving cannot overwrite it with an empty canvas.
The editor
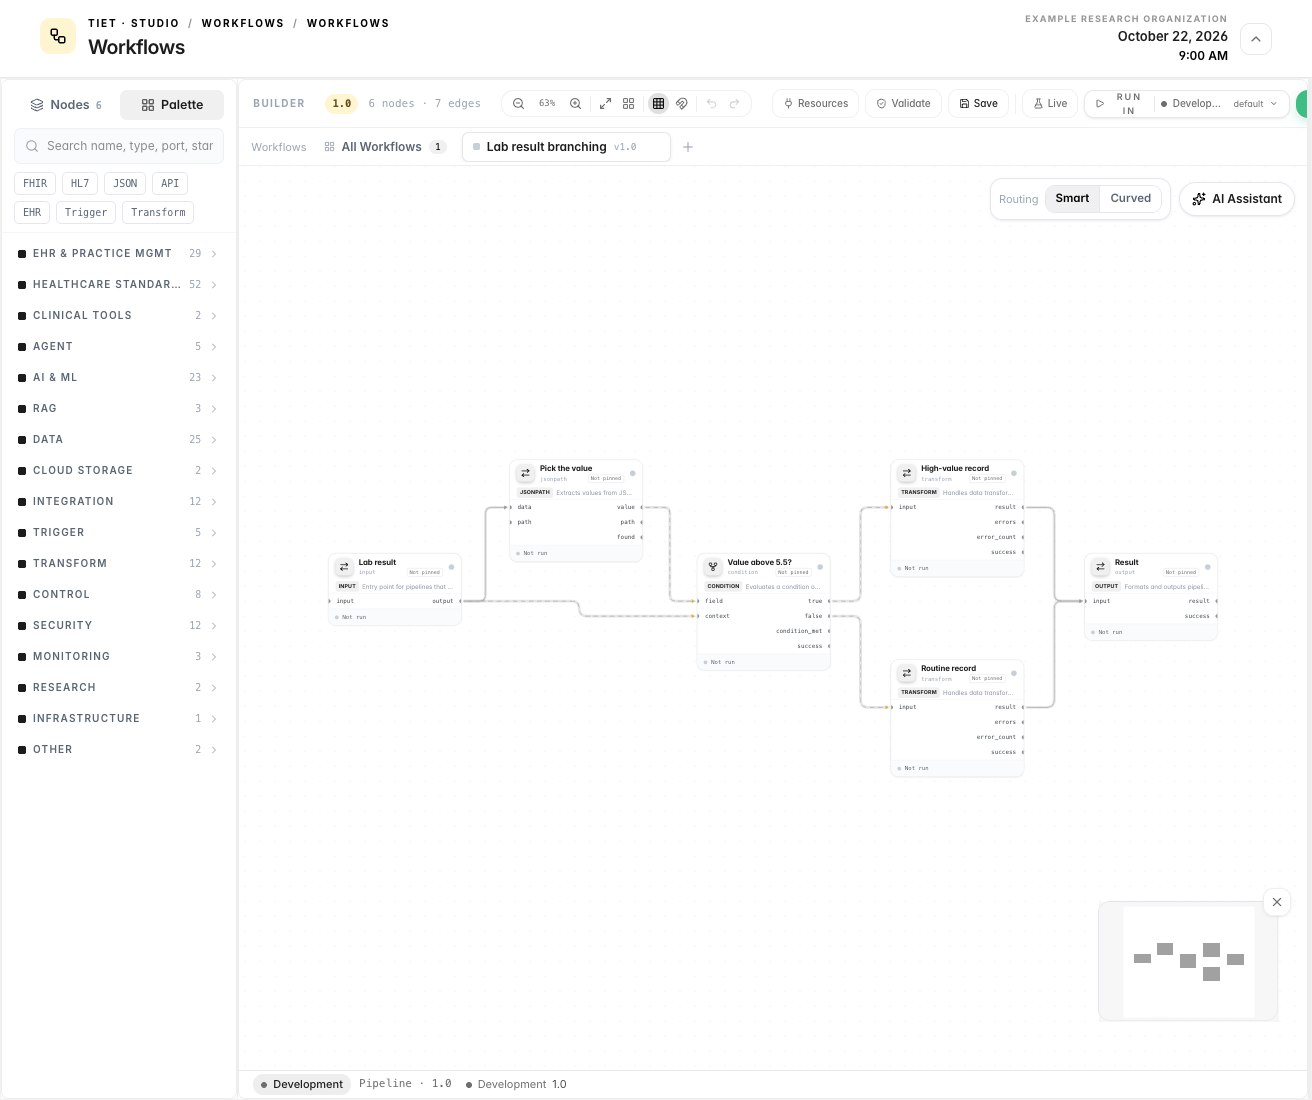
The editor has these areas:
- Tab bar. A pinned All Workflows tab returns to the home page. Each open workflow has a tab showing a small status square (amber when there are unsaved edits; otherwise green for Active, amber for Paused, red for Deprecated, grey otherwise), its name, and its version as
v<version>(ordraftbefore the first save). The + button (New Workflow) opens another tab. Leaving a tab with unsaved changes asksUnsaved Changeswith Save, discard and cancel choices. - Toolbar (top): workflow name, version badge, an amber dot when there are unsaved changes,
<n> nodes · <m> edges, canvas controls, then Resources, Validate, Save, Test/Live, Run and Deploy. - Left panel: Nodes and Palette.
- Canvas (middle), with a Routing switch and an AI Assistant button at its top right, and a status bar below it.
- Right panel: Inspector, Assistant, Diff, Docs and API tabs. It opens when you select a node or an edge, or open Resources or the Assistant, and collapses when none of these apply.
- Bottom panel: the execution panel with EXECUTION LOG, STEP DEBUG, TRACE and, during a mesh run, MESH.
The status bar under the canvas shows an environment pill with the name of the active project's environment (development in the default setup), Pipeline · <version>, and one dot per environment of your organization. Only the project's own environment shows the open version; the others show a dash. The pill is not switchable (its tooltip reads Switch environment (coming soon)). After a run, the bar shows Last run: <time> with a check, cross or spinner.
Left panel: Nodes and Palette
The left panel has two tabs. It opens on Nodes if the workflow already has nodes, and on Palette if the canvas is empty.
- Nodes lists the nodes of the open workflow in execution order (ties broken by canvas position, left to right). Each row has the node's name and a dot showing its status in the last run. Click a row to select the node and centre the canvas on it. The tab shows the node count; the list header reads
Nodes · <n>. - Palette is the catalog of nodes you can add. Drag a card onto the canvas to add the node.
Search and quick filters
The search box (Search nodes… on the Nodes tab, Search name, type, port, standard… on the Palette tab) matches the node id, name, category, description, port types and compliance tags. While you search, every category with a match is expanded. If nothing matches, the palette shows No matching nodes.
Under the search box the Palette shows seven quick filters: FHIR, HL7, JSON, API, EHR, Trigger and Transform. A filter is a text match against the same fields (it is not a category), and it is only shown when at least one node matches. Click a filter to apply it and click it again to clear it.
Categories
The palette groups nodes by the category the engine reports. Categories are listed in this fixed order, each with its node count in the current catalog of 198 nodes. A category with no nodes is not shown.
| Palette heading | Nodes | Palette heading | Nodes |
|---|---|---|---|
| EHR & Practice Mgmt | 29 | Transform | 12 |
| Healthcare Standards | 52 | Control | 8 |
| Clinical Tools | 2 | Security | 12 |
| Agent | 5 | Monitoring | 3 |
| AI & ML | 23 | Research | 2 |
| RAG | 3 | Infrastructure | 1 |
| Data | 25 | Other | 2 |
| Cloud Storage | 2 | ||
| Integration | 12 | ||
| Trigger | 5 |
The interface also defines headings for IoT & Wearables, Databases and Messaging; no node in the current catalog uses them. Categories the interface does not know about (analytics and database today) fall under Other. A few engine categories are folded into others: http and notifications into Integration, filesystem into Data.
Each palette card shows the node name, a one-line description, up to three port-type chips (for example JSON, TEXT), up to two compliance tags, and a simulated or prototype badge for nodes that are not production implementations. A simulated node returns demo data and is not for production clinical use.
Canvas
Adding and connecting nodes
- Drag a node from the Palette onto the canvas.
- Drag from an output port (right side of a node) to an input port (left side of another node). The builder refuses the drop if both port types are known and incompatible (see Ports, types and data flow).
- Click an edge to select it; the Inspector then shows the edge. Press Delete or Backspace to remove the selected edge.
- Drag an edge end to another port to reconnect it.
Click a node to select it and open its settings in the Inspector. Right-click a node for a menu with Configure, Inspect Data (only after a step-debug run that has results for that node), Duplicate and Delete Node. Right-click empty canvas for Pipeline Properties.
Node anatomy
Each node card shows:
- an icon chip in the colour of its category, the node name, and under it the node id and a version chip (
Not pinneduntil the workflow is saved or run, then the pinned release); - a coloured status dot (grey when idle) and, in the footer, the status of the last run: Not run, Running, Succeeded, Failed, Skipped, Waiting for input, No work, Pending review, Partially completed, Degraded output or Cancelled;
- up to two compliance tags;
- input port names on the left and output port names on the right, each with a coloured dot (hover to see
name · type); - an amber beaker badge when a test fixture is active for the node, and
◉ <placement>in the footer when the node has a mesh placement.
Canvas controls
The toolbar centre has these controls: Zoom Out / Zoom In (with the current percentage), Fit View, Auto Layout (arranges nodes left to right), Show Grid / Hide Grid, Snap (on/off, 20-pixel grid), Undo (Ctrl+Z) and Redo (Ctrl+Shift+Z).
At the top right of the canvas:
- Routing: Smart / Curved. Smart draws edges as orthogonal, smooth-step lines. Curved draws Bézier curves. This changes only how edges look.
- AI Assistant toggles the Assistant tab (see Copilot).
At the bottom right is a minimap (180 by 120 pixels, pannable and zoomable). The × above it hides it, and a Map button brings it back. Scrolling to zoom and dragging to pan are standard canvas behaviours.
Right panel
| Tab | What it shows |
|---|---|
| Inspector | With a node selected: that node's settings (next section). With an edge selected: the edge. With the Resources drawer open: the drawer. Otherwise: Pipeline Properties (name, description, status, version, category, tags, node and connection counts, the pipeline id prefix, and a change history of who saved the workflow). |
| Assistant | The Copilot chat. |
| Diff | Appears only when a node is selected. Compares the node's captured inputs with its outputs from the last run or step-debug session. With no data it says Select a node, then run the pipeline (or step-debug) to compare its inputs against its outputs. |
| Docs | Documentation for the workflow. Generate writes it with AI, you can edit it (Edit only / Split view / Preview only), Save stores it, and there is a version history. Needs a saved workflow. |
| API | Appears for a saved workflow: code samples (cURL, TypeScript, Python, Java) to execute it over the API, the expected inputs, and the generation of a pipeline API key (name, description, expiry). |
Per-node settings (Inspector)
Selecting a node shows a header with the node name, its category and any badges, then these sections:
| Section | What you can do |
|---|---|
| Node version details | The pinned node version and schema digest. This workflow uses the saved node version. Editing configuration does not upgrade it. |
| Test Fixtures / Test Inputs | Only when Test mode is on. Fixtures replace the node's output; Test Inputs set per-port input overrides for the node (form or raw JSON). |
| Identity | Display name. |
| Ports | The node's input and output ports with their types. |
| Connections | Incoming and Outgoing edges (source node and port type); click one to select the edge. |
| Runtime | Runs on (placement): empty means the node runs on the platform VM; naming a spoke or the hub distributes it (see Run on mesh). Timeout (s). Schema: a summary of the node schema. |
| Node Settings | The node's own config fields, generated from its schema (Custom Config if no schema is available). |
| Execution | Read-only facts from the schema: Mode, Streaming (Supported), Retryable (up to N times). |
| Last output | The node's output from the last run, with a way to pin it as a test fixture. |
If a node has no timeout set, the engine applies a default of 5 minutes per node. The engine also stops a whole run after 30 minutes. I found no setting in the workflow definition or the Builder that changes the 30-minute limit.
Toolbar
| Control | What it does |
|---|---|
| Workflow name | Click to open Pipeline Properties (a dialog with Name, Description, Version). |
| Version badge | Shows the workflow version exactly as typed, for example 1.1. Its tooltip reads Pipeline version <version>. |
| Resources | Opens the Resources drawer. |
| Validate | Sends the canvas to the server for checking. The button becomes Validating, then Valid (green) or Invalid (red). Hover to see the error messages. See Validate. |
| Save | Opens the Save New Version dialog (below). |
| Test / Live | Toggle. Test (amber) means runs use fixtures (Test mode ON — using fixtures); Live means runs use live connectors (Test mode OFF — live connectors). |
| Run in selector | At the top right of Studio, next to the toolbar. Chooses the environment that Studio runs execute in: Default or any active local environment of your organization. Each entry says runs what you ask (the environment allows draft execution) or runs only deployed versions. A workflow saved from the Builder is a draft, so the server refuses to run it in an environment that does not allow draft execution. |
| Run split button | Runs the workflow; the arrow opens more run options. |
| Deploy | See Deploy. |
Save and versions
Save (or Ctrl+S / Cmd+S) opens a dialog titled Save New Version. It shows the Current version, suggests a New version by adding 1 to the last number (1.0 becomes 1.1, 2.9 becomes 2.10), and the button reads Save v<version>. You can type any version text. Saving writes the workflow with its name, description, version, category, tags and status. If the server refuses the save, a Save failed message shows the reason.
The Builder has no separate "publish" step: a saved workflow is stored under its version label. Whether a version is live depends on its triggers (for example an HL7 listener node receives messages as soon as the workflow is saved; it does not wait for Deploy).
Workflow status
The Status field in Pipeline Properties (Inspector with nothing selected) sets the lifecycle status:
| Status | Tab square |
|---|---|
| Draft | grey |
| Active | green |
| Paused | amber |
| Deprecated | red |
These are values you set and save with the workflow; the builder uses them only to colour the tab, and I found no builder behaviour that depends on them. Running, Succeeded and Failed are not workflow statuses; they are the statuses of a single run (see the node and card labels above). Running Deploy to an environment replaces the status with deployed:<environment slug>.
Validate
Validate posts the canvas to the server's pipeline validator. It reports an error (and the button turns Invalid) for: an empty node type, an edge to a missing node, a self-loop, and a cycle (cycle detected: ...). It reports warnings, which do not make the button red, for: unknown node types, disconnected nodes (node "x" (type) is disconnected — has no edges; trigger nodes are exempt), duplicate edges, port type mismatches and clinical lint findings. Only the error messages appear in the button tooltip.
Validate does not check that a port name exists, and it does not run the workflow.
Run options
Run needs a saved workflow. The primary button saves the workflow first (without the version dialog) and then runs it. If the workflow was never saved, Run does nothing and the other menu items are disabled until you save once with Save.
| Item | What it does |
|---|---|
| Run (also the main button, Ctrl+Enter) | Saves, then executes the full workflow with the current Test/Live setting. The request stays open until the run finishes and the results appear in the bottom panel. While running, the button becomes Stop. |
Debug step-by-step (Pause at each node) | Starts a step-debug session on the saved definition; it does not save first. See Debugging. The main button reads Debugging during a session. |
Run with inputs (Override variables first) | A dialog titled Run with inputs with a JSON box, prefilled from the defaults (or data) of the workflow's input node. Invalid JSON shows Invalid JSON and disables Run. The object is sent as the run's inputs. |
Dry run (Run in test mode) | Saves, then runs exactly like Run; it uses whatever the Test/Live toggle says. Switch the toggle to Test first if you want fixtures. |
Schedule (Recurring execution) | Opens Schedule pipeline, which explains that scheduling means a Scheduler trigger node at the start of the workflow. It offers presets (Every 15 minutes, Every hour, Every 6 hours, Daily at midnight, Daily at 8 AM, Weekly (Mon 9 AM)) and a Custom cron expression, and a button Add Scheduler node (<cron>) that adds a scheduler node to the canvas. See the note below. |
Run on mesh (Distributed across sites) | Disabled until at least one node has a Runs on (placement) value. Opens the same inputs dialog, then starts a distributed run and opens the MESH tab. See Run on mesh. |
Add Scheduler node only adds an empty scheduler node to the canvas; the cron text shown on the button is not written into the node. The scheduler node's own settings are schedule_type (interval, once or daily), interval_seconds, execute_at (an RFC 3339 timestamp) and time_of_day (HH:MM); it has no cron field. Set them in the Inspector and save.
To run a workflow on a cron expression, use Tiet · Studio → Workflows → Monitor → Schedules → New schedule: pick the workflow, enter a Cron (with presets), optional inputs, and enable it.
Test and Live
The Test/Live toggle and the Test Mode switch in Resources → Test Data are the same setting. In Test mode, a fixture attached to a node replaces that node's output and the node does not execute; per-node Test Inputs are merged into the node's inputs. In Live mode, nodes run against their real connectors. The setting is saved with the workflow.
Resources drawer
Resources opens a drawer titled Pipeline Resources with four tabs. The content is saved in the workflow definition.
| Tab | What it holds |
|---|---|
| Connectors | Shared connections for nodes. Add Connector opens Select Connector Type (searchable, grouped by category), then a form with a required Connector Name and the fields for that type. Added connectors start as untested. A node can inherit a pipeline connector of its type unless its use_pipeline_connector is false. |
| Variables | PIPELINE VARIABLES: name, type (String, Number, Boolean, JSON), value, optional description and a secret toggle. Use them as {{name}} in node settings. Secret variables are not substituted; see placeholders. The tab also lists five SYSTEM VARIABLES that the engine does not resolve; use {{run.id}} and the other {{run.*}} names. |
| Storage | Add Storage: name, type (Google Cloud Storage, AWS S3, Local Filesystem, SFTP), bucket and prefix. Read in nodes as {{storage.<name>.<field>}}. |
| Test Data | The Test Mode switch (Use fixtures instead of live connectors) and New Fixture: a name, a target node and an inline JSON object. A fixture is attached to the target node's output. |
Bottom panel
| Tab | What it shows |
|---|---|
| EXECUTION LOG | One sub-tab per run (status badge and the first 8 characters of the run id, closable). Lines are marked ✓ (done), ✗ (error), ⟳ (running) and ▶ (start). With no runs: No executions yet. Press Run (Ctrl+Enter) to execute the pipeline. A Monitor link opens the run in Tiet · Studio → Monitor. The trash icon clears all logs, and the chevron minimizes the panel. |
| STEP DEBUG | A Timeline of steps and nodes on the left and an inspector on the right showing the selected node's data as JSON, Tree or Table. |
| TRACE | The span tree of the run. When no run is selected it offers a Past run picker with the last runs of this workflow. |
| MESH | Appears only after Run on mesh: per-site segment progress. |
When a workflow fails, the Assistant tab opens with the error (see below).
Debugging
Debug step-by-step runs the saved workflow one batch at a time. A floating toolbar appears on the canvas with the step counter (<step> / <total>, or Done) and four buttons: Continue (run to end), Step over, Restart and Stop debugging. The STEP DEBUG tab has the same controls: Next, Run All, Restart and Stop.
After each step, node cards show their status, Inspect Data (node right-click menu) opens that node's data, and the Diff tab compares its inputs to its outputs. This is the quickest way to see what a port really carried.
Deploy
The Deploy menu header reads Pipeline <version> · <environment of the active project>. Its items:
| Section | Item | State |
|---|---|---|
| Deploy | One item Deploy <version> to <environment name> for every other active environment of your organization; No other environments. when there is none | Works for a saved workflow. |
| Activate | Enable schedule, Enable trigger | Disabled. |
| Export | Export as JSON, Export as YAML | Work. They download the workflow definition as <name>.json or <name>.yaml. |
| Export | Push to external platform instance | Disabled. |
| Deployment history | Disabled. |
What Deploy really does. It saves the workflow and then asks the server to set the workflow's status to deployed:<environment slug>, and records the change in the workflow's change history. The environment must exist and be active in your organization's environment registry, otherwise the server refuses it. It does not copy the workflow to another environment, check a hash or ask for approval, and it does not start anything; the menu's footer (one dot per environment) shows the open version only for the project's own environment and a dash for the others. The environments, promotion and approval features described in Environments & Promotion are separate from this menu.
Copilot (AI Assistant)
Open it with AI Assistant (top right of the canvas) or the Assistant tab. The input box reads Ask AI Assistant..., and an empty chat says Ask me to build a pipeline or configure nodes.
How it works:
- You send a message. The Copilot is sent your message, the chat history, and the current nodes and edges.
- It returns one complete reply (shown as formatted text while a spinner reads
Thinking...). The reply is not streamed word by word. The Stop generation button cancels the request. - A reply can include an action, shown as a button
Apply: <action type>and optionally suggestion chips. Nothing changes on the canvas until you click Apply. Actions include adding or removing nodes and edges, inserting a node between two nodes, updating node settings, adding variables, connectors and storage, adding fixtures, turning Test mode on or off, updating workflow properties, building a whole workflow from a description (build_pipeline) and generating the Docs. - When a run fails, the Assistant opens by itself with an Execution Error message that explains what happened, why and how to fix it, without applying anything. Click Auto-fix (it sends
Apply the fix automatically) and the Copilot applies one change at a time, re-reads the canvas, and stops when it has nothing more to apply or repeats an action.
Each message has Copy and Delete on hover; the header has New conversation and Conversation history. Review every applied change: the Copilot can propose wiring that Validate does not catch.
Keyboard shortcuts
These are the only shortcuts the builder defines. On macOS use Cmd in place of Ctrl.
| Keys | Action |
|---|---|
| Ctrl+S | Open Save New Version. |
| Ctrl+Enter | Save, then run (saved workflows only). |
| Ctrl+Z | Undo. |
| Ctrl+Shift+Z or Ctrl+Y | Redo. |
| Esc | Deselect the node and edge, close menus and Pipeline Properties. |
| Delete or Backspace | Remove the selected edge. |
To delete a node, use Delete Node in its right-click menu.
Representative nodes
The builder offers every node in the catalog. These are a few you will use often, with their real ids. Open the node in the palette to see all of its ports and settings.
| Node (id) | Category | What it does |
|---|---|---|
Input (input) | Transform | Entry point. defaults, required_fields. Output port output carries the whole record. |
Condition (condition) | Control | Routes to a true or false port. Settings field, condition_type, compare_value, pass_through. |
Transform (transform) | Transform | Maps, filters, merges and extracts data (transformation_type, mappings). |
Output (output) | Transform | Formats the final result (format: json, text, Markdown, HTML or CSV). |
HL7 Listener (hl7-listener) | Trigger | Receives HL7v2 over MLLP. See Receive ADT messages. |
HL7 to FHIR (hl7-to-fhir) | Healthcare Standards | Converts an HL7v2 message to a FHIR R4 bundle. |
FHIR CRUD (fhir-crud) | Healthcare Standards | Search, read, create, update, delete and transaction on a FHIR server. |
Epic FHIR (epic-fhir) | EHR & Practice Mgmt | Reads patient data from Epic over FHIR R4. |
Scheduler (scheduler) | Trigger | Interval, one-time or daily scheduling. |
LLM (llm) | AI & ML | General-purpose LLM call (provider, model, system_prompt). |
Agent Executor (agent-executor) | Agent | An LLM agent with iterative tool use. |
Limits and not yet available
- The builder enforces no node or edge count. The engine's default per-node timeout is 5 minutes, and its default overall execution limit is 30 minutes.
- In the Deploy menu, schedule and trigger activation, push to another instance and deployment history are disabled placeholders.
- The environments in this page are the ones in your organization's registry. In a fresh organization they are
development,stagingandproduction. - The per-environment dots in the status bar, the Deploy menu footer and on workflow cards do not reflect hash-checked promotions; only the project's own environment shows a version.
- A mesh run needs at least one node with a placement. See Run on mesh.
Something unclear? Send documentation feedback by email.